


UPDATE: Storms for winter 2013/2014 now added.
European windstorms are capable of producing devastating socioeconomic impacts. For example the windstorms Anatol, Lothar and Martin that struck in December 1999 inflicted 14bn USD worth of damage (Swiss Re, Sigma). Specifically, European windstorms are capable of causing power outages to millions of people, closing transport networks, uprooting trees, causing walls, buildings and other structures to collapse, which in the worst cases can result in dozens of fatalities (BBC News 1999, 2004, 2005, 2007, 2009, 2010).
Animation showing the track and instantaneous 3-second gusts at 3 hour intervals for the windstorm Kyrill (January 2007). The gusts are from the Met Office Unified Model at 25km resolution, generated by dynamically downscaling ERA Interim (Dee et al, 2011) Re-analysis data.
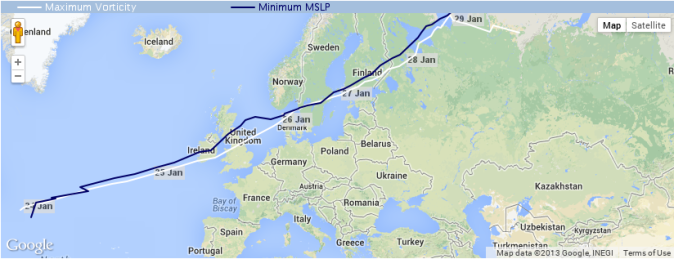
The XWS 'eXtreme Wind Storms' catalogue is a freely available database of storm tracks and model-generated maximum 3 second gust storm footprints (both raw and re-calibrated) at ~25km resolution for 50 of the most extreme windstorms to hit Europe in recent times. The catalogue currently covers the period October 1979 - March 2013. An estimate of the uncertainty of the gusts for each re-calibrated storm footprint is also provided.
The catalogue is intended to be a resource for both academia and the (re)insurance industry. Characterising the intensity, location and frequency of windstorms in the past is crucial to understanding the factors that influence these events (such as position of the jet stream or NAO index), and for evaluating and improving the predictions of weather and climate models.
To our knowledge this is the first freely available, digitised catalogue of European windstorm tracks and footprints. More information on European windstorms and how the database was created can be found on the following webpages:
The methods and database are also summarised in more detail in The XWS open access catalogue of extreme European windstorms from 1979 to 2012 by Roberts et al (2014).
Examples of some of the plots available are shown on the right and at the bottom of this page.
Licensing: The data provided on this site can be used for research and commercial purposes under the Creative Commons CC BY 4.0 International Licence: http://creativecommons.org/licenses/by/4.0/deed.en_GB. The following citation should be used for the XWS Datasets: (c) Copyright Met Office, University of Reading and University of Exeter. Licensed under Creative Commons CC BY 4.0 International Licence: http://creativecommons.org/licenses/by/4.0/deed.en_GB.
Disclaimer: The organisations involved give no warranty as to the quality or accuracy of the information on this website or its suitability for any use. Your use of information provided by this website is at your own risk.